The benefits of working with Channel business intelligence are obvious:
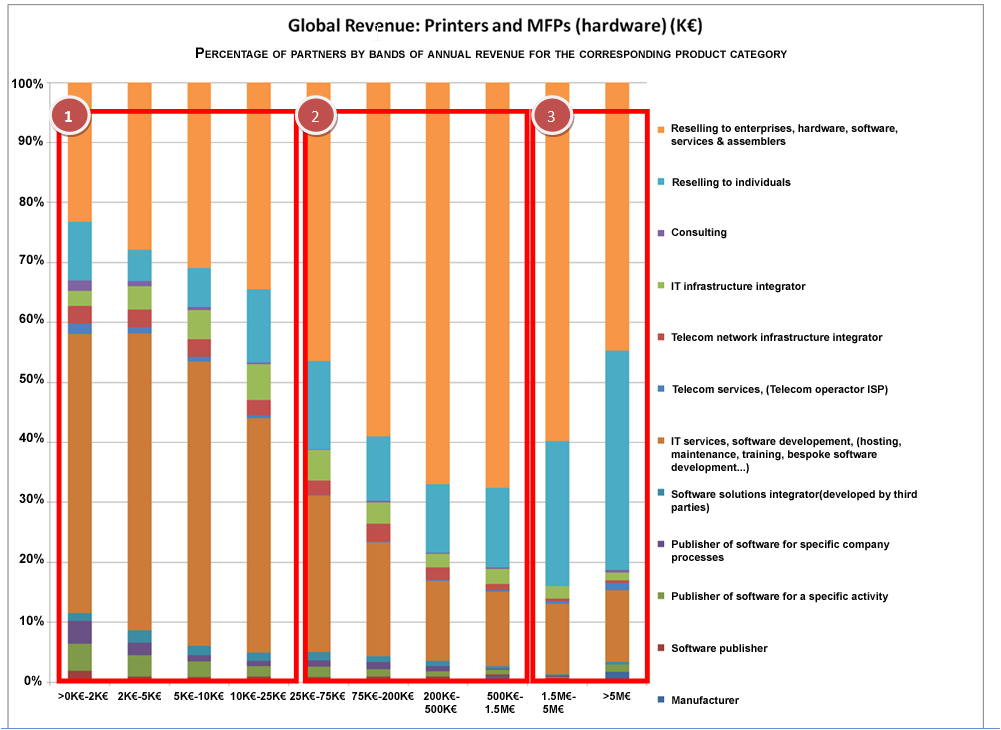
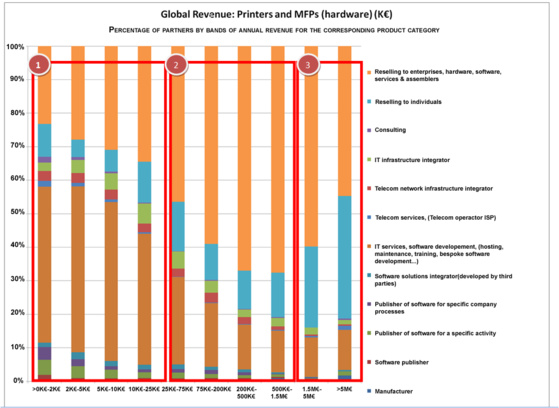
For example: The following graph shows the main activities for partners in the printing channel by range of revenue.
We can see that the typology of a distribution network selling over 200K/annum in printing products is completely different to that of a network making 10K€/annum.
A closer look shows reveals that there are 3 main groups within the distribution network:
- Companies making an annual TO in printing products of less than 25 K€, where the market is fragmented and service companies are well represented.
- Companies making an annual TO in printing products between 25 K€ et 1.5 M€, where the market is dominated by B2B distribution
- Companies making an annual TO greater than 1.5 M€ in printing products where retail looms large
OTHER LINKS
To find out more about our database of partners for printing solutions contact us here


 Consulting Services


